Library membership mapping
These are instructions for using two prototype web tools to visualise library membership data. The pre-requisite is for library services to be able to extract postcodes of library members. It’s down to the service which postcodes to include: it could be all members, those who are borrowers, ones with fines owing, PC users, etc.
- Convert postcodes to a standard format using anonymised, census-based areas
- Visualise the data on a map, which can provide additional context on population and deprivation
Note on security and data protection
These tools take the privacy of library users seriously. Data protection is described in these instructions, and while using the tools. If there are any queries or concerns please do stop and email [email protected].
Stage 1: Create data in the correct format
The first stage is getting data into the right format. The format is a taken from the library data schema project, co-ordinated by the DCMS, which specifies that the data should be membership counts by census areas. Census-based areas are useful for analysis: they allow us to measure library membership relative to population in small areas, as well as incorporating other information such as the deprivation of each area. This tool converts postcodes into these areas. For postcodes in England and Wales it converts to LSOA (lower super output area), for Northern Ireland to Small Area, and for Scotland, Data Zone.
If services do not wish to use a web tool for this step, the conversion could be done manually with publicly available data, such as the Office for National Statistics Postcode directory, but this would require more data wrangling. If doing that, skip to stage 2!
If you are interested in exploring this process, but not yet ready to use your own data, you could use Barnet membership data. Download the latest copy of their data and move to Stage 2.
a) Create a CSV file of your postcodes
A CSV file (comma separated values) is a computer-readable format for storing data. Most spreadsheet programs like Excel can save to CSV (using File > Save As).
The file should contain a column with a header as the first row, and a list of postcodes for the remaining rows. It’s recommended that you remove any additional data.
Your file should look like the following (for however many members there are). There is no need to count the postcodes, or aggregate them in any way.
| Postcode |
|---|
| BA1 1RG |
| BA2 2PU |
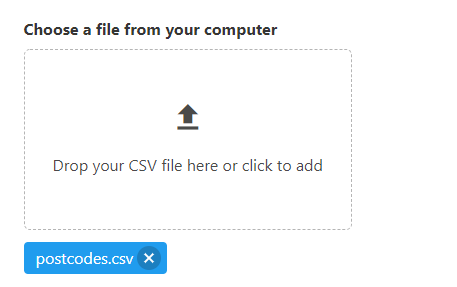
b) Load the data into the postcode tool
Go to Convert postcode data to statistical area
Choose your file containing postcodes. As long as it is a valid CSV file it will be loaded into the tool. This is not uploading data, the data is being accessed by the web browser on your PC.
c) Select which column contains postcodes
The tool will then ask you which column contains postcodes. If you have data like the previous example there will be one option called ‘Postcode’.
You can ignore the additional optional section asking for a count column. This is used for data that has counts of members per postcode.
Select to convert the data.
A further data protection note
You may be worried that postcodes are transmitted online. They aren’t, but it’s a sensible concern. Although it’s rare, a full postcode can relate to an individual, or at least a small number of people. The tool does send data online, to work out what the census areas are, but it uses the postcode sectors.
Imagine this as a discussion between the web browser (your PC) and the online service, it would be like this:
Your PC: Hello, I have a postcode I want more details about, what can you tell me about the postcode sector ‘BA1 1’?
Online: Well, postcode sector ‘BA1 1’ has 353 postcodes in it, here they are, along with the census area codes.
Your PC: Thank you. That’s more than I need, but I can look through and find the right matches.
In this way the tool can look up details of postcodes without communicating the full postcode. Regardless of this, all data communication is securely encrypted, to a server held in the UK, and no data is saved from those requests.
An alternative option would be for the tool to download ALL postcode and census area combinations. That would be possible, but there are over 2.5 million postcodes, and it’s a lot of data.
d) Generate the data
On completing the previous step, the tools whirrs for a period of time (it could be at least a few minutes), then reports results. That includes a table of how many postcodes were valid, how many out of date (terminated), and how many unknown.
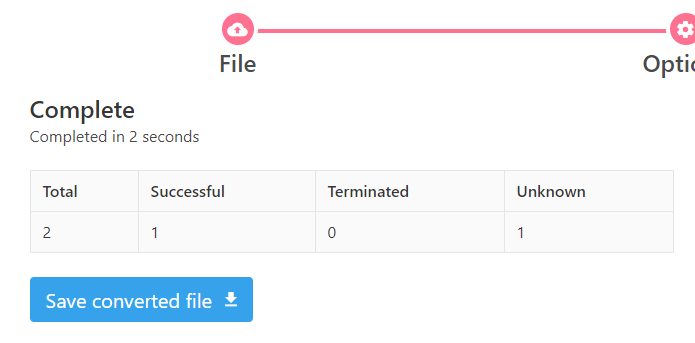
This could be useful for library services to validate their current data.
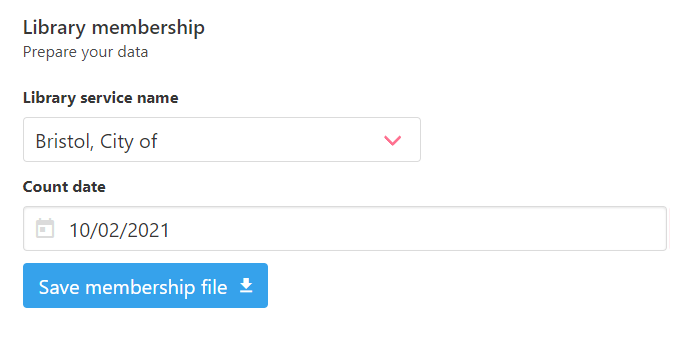
The file you need to save is the second one listed, titled ‘Library membership’. Choose your service name, select a date you did the extract, and select to save the file.
Congratulations! You have data on library members in a standard format that can be used in the visualisation tool. The data is anonymised, and using areas appropriate for statistics. You may wish to share the data widely and give more people access to explore it.
Stage 2: Visualise data
Now comes the exciting part! Another tool has been created to visualise this data.
a) Load the data
Go to Membership map
Choose the file you have saved from Stage 1 and select to Add to the map. It will be loaded into the tool, and all being well, the map will zoom to the relevant library service.
b) Explore
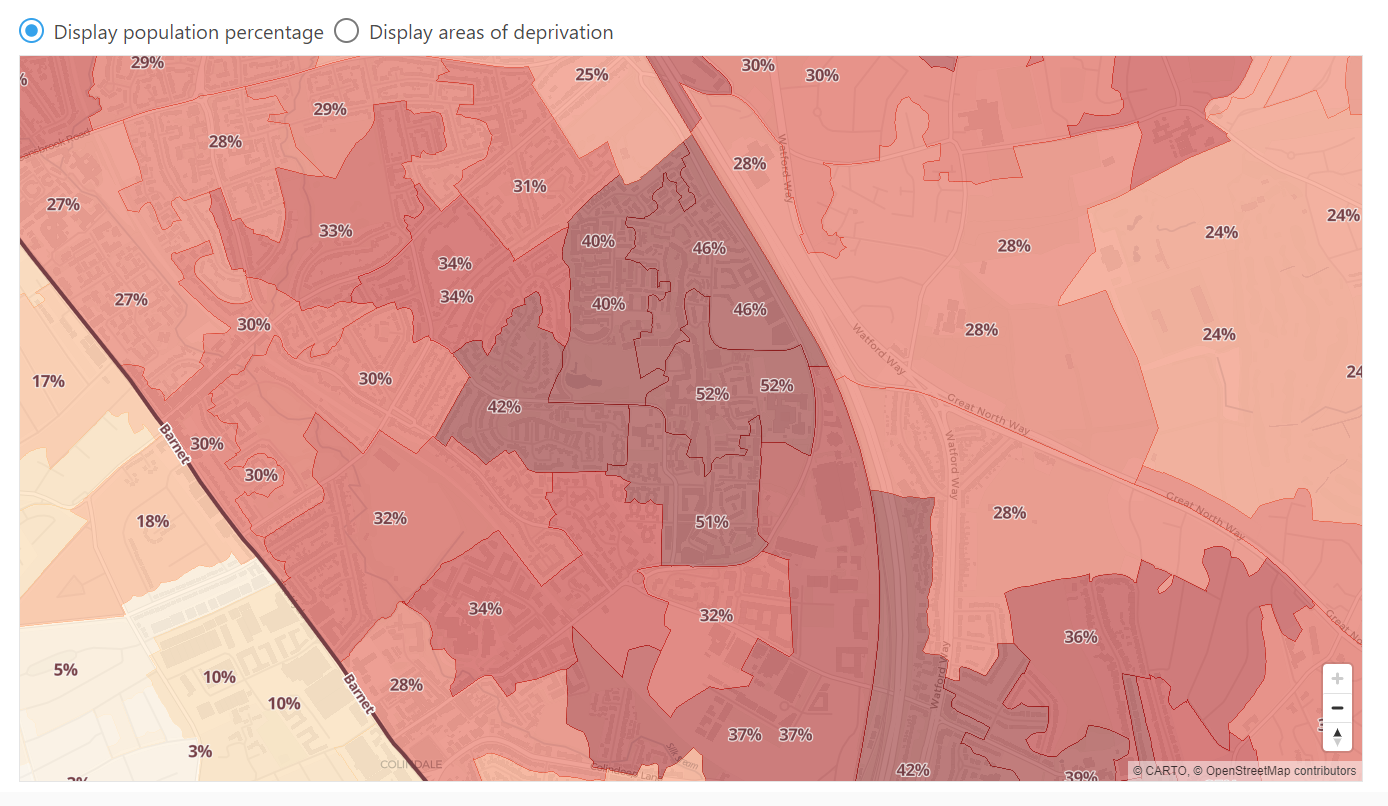
And that’s really it! The map provides a view of membership data, and an option to toggle to display areas of deprivation. If you zoom in the map will display population percentages and the index of multiple deprivation for each area.
Feedback as to the usability is most important. Please try it out, and kindly report problems and suggestions. It is designed as an open and free tool for library services to use and influence.